Break-even analysis helps you answer one of the most important financial questions in a small business: how much do you need to sell before you stop losing money?
In this guide, you will learn what break-even analysis is, how to calculate the break-even point in units and sales dollars, how contribution margin affects the result, and how changes in price or costs can move your break-even point. You can also download a free Excel break-even analysis template to apply the calculation to a single product or service.
Key formulas
Break-Even Point (Units) = Fixed Costs ÷ Contribution Margin per Unit
Break-Even Sales ($) = Fixed Costs ÷ Contribution Margin %
Table of Contents
- What Is Break-Even Analysis?
- What Is Break-Even Analysis Used For?
- How to Calculate the Break-Even Point
- Limitations of Break-Even Analysis
- How Break-Even Changes in a Real Business
- Free Break-Even Analysis Template
- Break-Even Analysis for Multiple Products
- Break-Even Sensitivity Analysis
- Break-Even Analysis vs. Cash Flow
- Frequently Asked Questions
- Calculate Your Break-Even Point
What Is Break-Even Analysis?
Break-even analysis is a financial method used to determine the sales level at which total revenue equals total costs. At the break-even point, the business is not making a profit, but it is no longer operating at a loss.
You can express the break-even point in units or in sales dollars. Both approaches help you establish the minimum level of sales your business needs to cover fixed and variable costs.
The calculation is closely connected to contribution margin, which shows how much of each sale remains after variable costs to help cover fixed costs and eventually generate profit.
What Is Break-Even Analysis Used For?
Break-even analysis can help a small business make several practical decisions:
- Evaluate whether a business idea or project is financially realistic.
- Set minimum sales targets before expecting a profit.
- Support pricing decisions by showing how price affects contribution margin.
- Evaluate changes in costs, including rent, payroll, shipping, packaging, commissions, or software.
- Analyze investments or hiring decisions that increase fixed costs.
- Improve business planning by connecting costs, margins, and required sales volume.
Practical tip: recalculate your break-even point whenever fixed costs, selling prices, logistics costs, payment fees, commissions, or other important cost assumptions change.
Break-Even Point Graph
A break-even chart usually compares total revenue with total costs as sales volume increases. The point where both lines meet represents the break-even point. Sales below that level generate a loss; sales above it can begin to generate profit, assuming the cost and price assumptions remain valid.
How to Calculate the Break-Even Point
For the examples in this guide, we will use the following assumptions:
- Fixed Costs: $160
- Variable Cost per Unit: $7
- Selling Price per Unit: $15
- Contribution Margin per Unit: $8
- Contribution Margin %: 53.33%
The contribution margin per unit is calculated first:
Contribution Margin = Selling Price − Variable Cost per Unit
$15 − $7 = $8
The contribution margin percentage is:
Contribution Margin % = Contribution Margin ÷ Selling Price
$8 ÷ $15 = 53.33%
Break-Even Point in Units
This calculation shows how many units you need to sell to cover your fixed costs.
Break-Even Point (Units) = Fixed Costs ÷ Contribution Margin per Unit
Using our example:
$160 ÷ $8 = 20 units
The business must therefore sell 20 units to reach break-even. Starting with the next unit sold, the business can begin generating profit if the assumptions remain unchanged.
Practical application: unit-based break-even is especially useful for businesses that sell a limited number of standardized products or services.
Break-Even Point in Sales Dollars
Businesses with multiple transactions or products often find it more practical to track break-even in revenue rather than individual units.
Break-Even Sales ($) = Fixed Costs ÷ Contribution Margin %
Using the same example:
$160 ÷ 0.5333 ≈ $300
The business needs approximately $300 in sales to cover its fixed and variable costs under these assumptions.
Tracking break-even in sales dollars can be useful when your sales reports, budgets, or targets are primarily managed in revenue rather than units.
Limitations of Break-Even Analysis
Break-even analysis is useful, but it is still a simplified financial model. Its limitations should be understood before using the result for important business decisions.
- It is primarily an internal planning tool and does not measure market demand or competitor behavior.
- It assumes that selling prices and variable costs remain reasonably stable within the period analyzed.
- Discounts and promotions can reduce contribution margin and increase the break-even point.
- It does not tell you which specific costs should be reduced.
- It does not replace pricing research, customer analysis, demand forecasts, or competitive analysis.
- It measures profitability thresholds, but it does not guarantee that the business has enough cash available to pay its obligations.
How Break-Even Changes in a Real Business
In practice, a business’s break-even point can change even when sales appear stable. Small increases in packaging, shipping, transaction fees, commissions, direct labor, or supplier costs can reduce contribution margin and increase the amount the business must sell before becoming profitable.
This is especially relevant in retail and ecommerce. A store can generate significant revenue while still struggling financially if shipping, returns, marketplace fees, payment processing, packaging, and fulfillment consume too much of each sale.
The same principle applies to service businesses. If the direct labor or materials required to deliver each service increase but prices remain unchanged, contribution margin falls and the break-even point rises.
This is why break-even analysis should not be treated as a one-time calculation for a business plan. Recalculate it whenever you change prices, add products, renegotiate supplier terms, hire employees, increase fixed expenses, or significantly change your operating model.
Free Break-Even Analysis Template
You can use the free Excel template to calculate break-even for one product or service. The workbook calculates contribution margin, contribution margin percentage, break-even units, and break-even sales dollars from three inputs.
Quick Instructions
- Enter your monthly Fixed Costs.
- Enter the Variable Cost per Unit.
- Enter the Selling Price per Unit.
- Review the calculated Contribution Margin.
- Review the Contribution Margin %.
- Review the Break-Even Point in Units.
- Review the Break-Even Sales amount.
- Check the viability indicator before interpreting the result.
- Repeat the calculation whenever your price or cost assumptions change.
| Metric | Example Value |
|---|---|
| Fixed Costs | $160 |
| Variable Cost per Unit | $7 |
| Selling Price per Unit | $15 |
| Contribution Margin | $8 |
| Contribution Margin % | 53.33% |
| Break-Even Point | 20 units |
| Break-Even Sales | $300 |
Break-Even Example Step by Step
Suppose your business has:
- Fixed Costs: $160
- Variable Cost per Unit: $7
- Selling Price per Unit: $15
1. Calculate Contribution Margin
$15 − $7 = $8
2. Calculate Contribution Margin %
$8 ÷ $15 = 53.33%
3. Calculate Break-Even Point in Units
$160 ÷ $8 = 20 units
4. Calculate Break-Even Sales
$160 ÷ 0.5333 ≈ $300
Break-Even Analysis for Multiple Products and Sales Mix
If your business sells several products, break-even becomes more complex because each product can have a different contribution margin. In that case, you can estimate break-even sales using a weighted contribution margin percentage based on your sales mix.
Weighted Contribution Margin % = Σ (Sales Mix Weight × Contribution Margin %)
Then:
Break-How much does your small business need to sell to cover its costs? Break-even analysis calculates the sales volume at which total revenue equals total costs. It helps you set a minimum sales target before expecting an operating profit.
This guide explains the break-even formula in units and sales dollars, works through a small-business example in USD, and shows how pricing, costs, and product mix affect the result. You can also download a free Excel break-even analysis template for one product or service.
Quick answer: Break-even units = Fixed Costs ÷ (Selling Price per Unit − Variable Cost per Unit). Break-even sales dollars = Fixed Costs ÷ Contribution Margin Ratio.
Table of Contents
What Is Break-Even Analysis?
Break-even analysis is a cost-volume-profit (CVP) method used to find the point where total sales revenue equals the fixed and variable costs included in the analysis. At that point, operating profit is zero; below it, the business incurs an operating loss, and above it, sales can contribute to profit if the assumptions hold.
The calculation depends on contribution margin: the portion of each sale remaining after variable costs. That amount first covers fixed costs and then contributes to operating profit. For a practical introduction to classifying expenses, see our guide to fixed and variable costs.
What Is Break-Even Analysis Used For?
- Sales targets: estimate how many units or how much revenue is needed to cover costs.
- Pricing: test whether a discount would require an unrealistic increase in sales volume.
- Cost control: estimate the effect of higher materials, rent, payment processing, or shipping costs.
- Planning: compare the break-even threshold with forecast demand and realistic capacity.
- Hiring and investments: calculate how added fixed costs change the required sales level.
The U.S. Small Business Administration (SBA) presents break-even analysis as a planning tool for understanding costs, pricing, and sales requirements. It is not proof that customers will buy the required volume.
How to Calculate the Break-Even Point
Use the same time period for fixed costs and sales volume. For this monthly example, assume a small business sells one standardized product:
| Input | Monthly example |
|---|---|
| Fixed costs | $160 |
| Selling price per unit | $15 |
| Variable cost per unit | $7 |
Step 1: Calculate Contribution Margin
Contribution Margin per Unit = Selling Price − Variable Cost per Unit
$15 − $7 = $8 per unit. Each unit sold contributes $8 toward fixed costs and, once they are covered, operating profit.
Contribution Margin Ratio = Contribution Margin per Unit ÷ Selling Price per Unit
$8 ÷ $15 = 53.33% (rounded). In the sales-dollar calculation below, use the unrounded ratio of 8/15 to avoid rounding errors.
Step 2: Calculate the Break-Even Point in Units
Break-Even Units = Fixed Costs ÷ Contribution Margin per Unit
$160 ÷ $8 = 20 units. Selling 20 units generates $300 in revenue and $300 in total costs ($160 fixed + $140 variable).
If the formula produces a fraction and the business sells whole units, round up to the next complete unit. Rounding down would leave some fixed costs uncovered.
Step 3: Calculate Break-Even Sales in Dollars
Break-Even Sales ($) = Fixed Costs ÷ Contribution Margin Ratio
$160 ÷ (8/15) = $300 in sales. This matches 20 units × $15 per unit. When whole-unit rounding is required, actual revenue at the first break-even unit may exceed the theoretical sales-dollar threshold.
How Revenue and Costs Meet at Break-Even
A break-even chart plots revenue and total costs against sales volume. The lines intersect at 20 units in this example. The table below shows the same relationship without assuming that sales always follow the forecast:
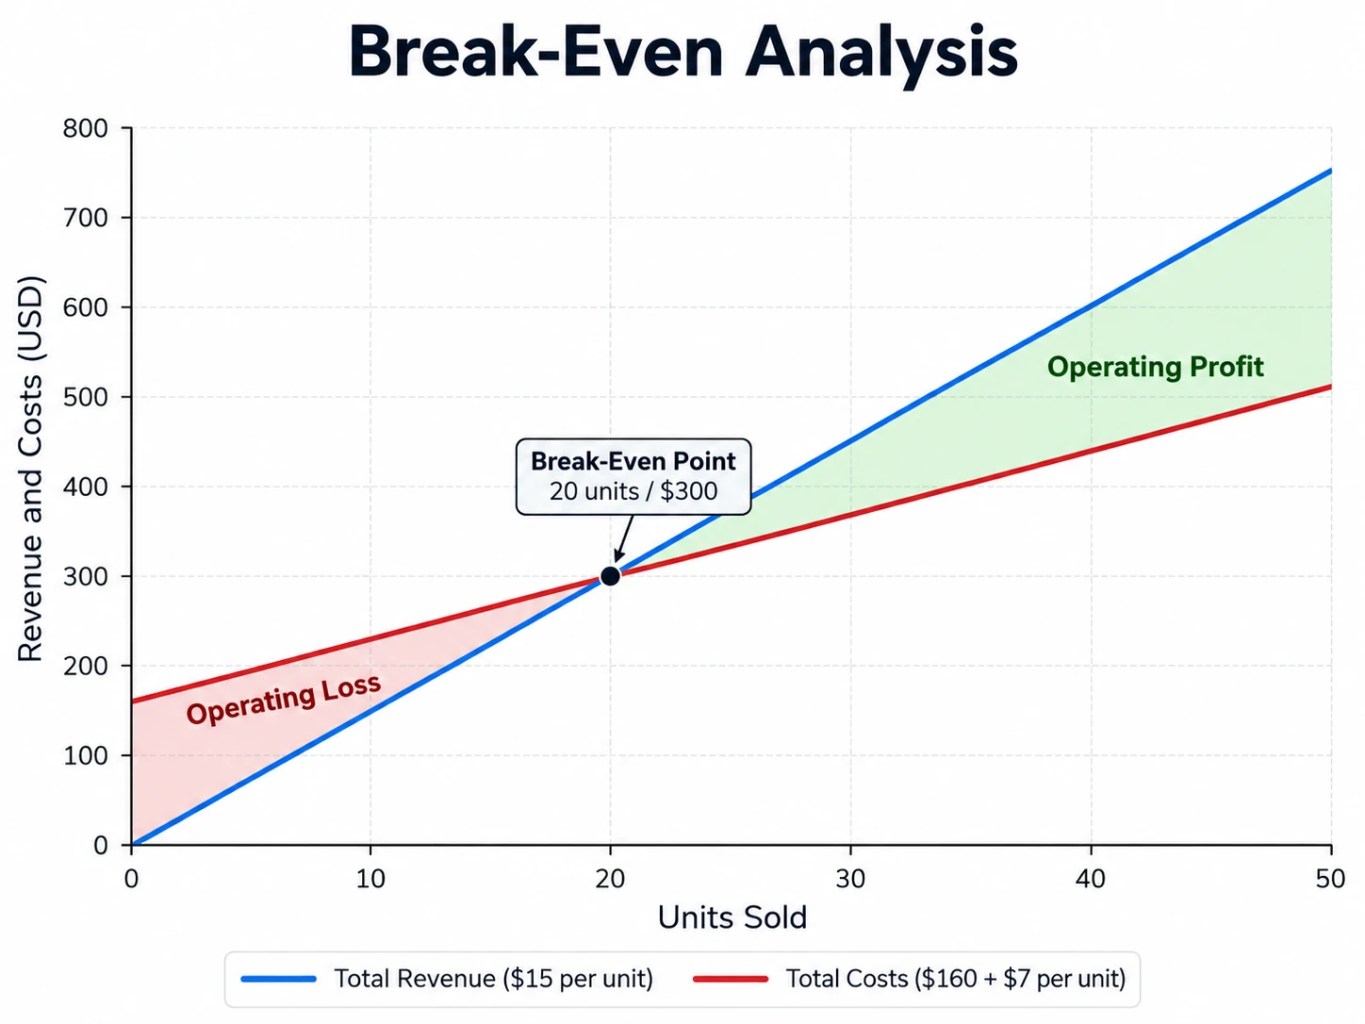
| Units sold | Revenue | Total costs | Operating profit / (loss) |
|---|---|---|---|
| 0 | $0 | $160 | −$160 |
| 10 | $150 | $230 | −$80 |
| 20 | $300 | $300 | $0 — break-even |
| 30 | $450 | $370 | $80 |
How Break-Even Changes in a Real Business
In retail and ecommerce, product cost is only one variable expense. Packaging, payment processing, marketplace commissions, order fulfillment, shipping subsidies, and expected return-related costs may also reduce the contribution margin. Include the relevant costs consistently, without double counting them.
For a service business, one unit might mean an appointment, billable hour, or completed job. Direct supplies, per-service commissions, and labor that varies with services delivered can affect the margin. A fixed monthly salary, however, should not automatically be classified as a variable cost.
Update your calculation after meaningful changes in prices, supplier terms, staffing, fulfillment costs, or the mix of products you sell. Compare the resulting threshold with expected demand rather than treating it as a guaranteed sales target.
Break-Even Analysis for Multiple Products and Sales Mix
For several products, a single-unit formula can be misleading because contribution margins differ. If product shares are measured as percentages of sales revenue, calculate a revenue-weighted contribution margin ratio:
Weighted Contribution Margin Ratio = Sum of (Product’s Revenue Share × Product’s Contribution Margin Ratio)
Suppose Product A represents 60% of sales revenue at a 40% contribution margin ratio, while Product B represents 40% of revenue at a 20% ratio:
(0.60 × 0.40) + (0.40 × 0.20) = 0.32, or 32%. With fixed costs of $160, estimated break-even sales are $160 ÷ 0.32 = $500.
This estimate assumes the revenue mix stays reasonably stable. If customers buy more lower-margin items, break-even revenue increases. The free workbook below handles one product or service, not an automated multiproduct sales-mix calculation.
Break-Even Sensitivity Analysis: What Happens When Variables Change?
Sensitivity analysis tests how changes in costs or selling price alter the minimum sales requirement. Each scenario below changes one assumption from the original $160 fixed-cost, $15 selling-price, $7 variable-cost example.
| Scenario | Contribution margin / unit | Minimum whole units | Theoretical break-even sales | Revenue at minimum whole units |
|---|---|---|---|---|
| Base: $160 fixed, $15 price, $7 variable | $8 | 20 | $300.00 | $300 |
| Variable cost rises to $8 | $7 | 23 | $342.86 | $345 |
| Price falls to $14 | $7 | 23 | $320.00 | $322 |
| Fixed costs rise to $200 | $8 | 25 | $375.00 | $375 |
Why the two sales columns differ: the theoretical amount is calculated using the contribution margin ratio, while actual revenue assumes whole units sold at the stated price. For example, $160 ÷ ($15 − $8) = 22.86 units; you must sell 23 complete units, generating $345, to cover the costs.
The management lesson is consistent: lower prices, higher variable costs, and higher fixed costs can all increase the sales volume required to break even. Compare these scenarios with realistic customer demand and capacity before making a decision.
Limitations of Break-Even Analysis
- Demand is not guaranteed: the formula does not tell you whether customers will purchase enough units.
- Costs and prices can change: the model assumes reasonable stability within the relevant sales range and time period.
- Mixed costs require care: expenses that contain fixed and variable components should be separated when practical.
- Product mix matters: changes in the share of lower-margin products can move the revenue threshold.
- Break-even is not cash sufficiency: timing of collections, inventory purchases, financing, and taxes may create cash pressure even when operating profit is near zero.
Break-Even Analysis vs. Cash Flow
Break-even analysis asks whether sales cover the costs included in the operating model. Cash flow forecasting asks when money will actually come in and go out. A business can reach accounting or operating break-even and still lack the cash needed to pay suppliers, service debt, or replenish inventory.
Once you have a break-even sales target, use our 12-month cash flow forecast template to examine the timing of receipts and payments. The two tools answer different, complementary questions.
Free Break-Even Analysis Excel Template
Download the free Excel workbook to enter fixed costs, variable cost per unit, and selling price per unit. The template calculates contribution margin, the contribution margin ratio, break-even units, and break-even sales dollars for one product or service.
- Enter your fixed costs for one consistent period (for example, a month).
- Enter the variable cost for each unit sold.
- Enter the selling price per unit.
- Review the calculated results and the workbook’s viability indicator.
- Recalculate when prices or costs change, and compare the threshold with a realistic sales forecast.
Free .xlsx file. The template is intended for single-product or single-service calculations; it does not forecast demand or calculate a multiproduct sales mix automatically.
Frequently Asked Questions About Break-Even Analysis
What Is the Break-Even Point Formula in Units?
Divide fixed costs by selling price per unit minus variable cost per unit. If the result is fractional, round up when selling whole units. The selling price must exceed variable cost per unit for this basic formula to produce a positive contribution margin.
How Do You Calculate Break-Even Sales Revenue?
Divide fixed costs by the contribution margin ratio expressed as a decimal. For example, a 40% margin ratio means dividing fixed costs by 0.40, not by 40.
How Do You Calculate Break-Even for a Service Business?
Define a consistent unit such as one appointment or billable hour, estimate the variable costs to deliver it, and subtract those costs from the price charged. Divide the period’s fixed costs by the resulting contribution margin per service.
What Should an Ecommerce Store Include?
Consider product costs and the additional variable costs associated with orders, including payment processing, marketplace fees, packaging, fulfillment, shipping subsidies, and expected returns where relevant. Avoid counting the same cost in more than one category.
What Happens When You Offer a Discount?
If variable cost stays constant, a discount reduces contribution margin and raises the number of units required to break even. Estimate whether the promotion could realistically generate enough additional volume to compensate.
What If Variable Cost Equals or Exceeds the Selling Price?
Contribution margin is zero or negative. Under the basic model, selling more units cannot cover positive fixed costs; the business must revisit pricing, variable costs, or its operating model.
How Often Should Break-Even Be Recalculated?
Review it when material prices, rent, labor, product mix, fees, or other assumptions change. A periodic monthly or quarterly check may help businesses with fluctuating costs avoid relying on outdated targets.
Conclusion: Make Break-Even a Practical Sales Target
Break-even analysis turns costs and contribution margin into a clear sales threshold. Start with accurate cost classifications, calculate the result for a consistent period, and test what happens when price or costs change. Then compare that threshold with what your business can realistically sell.
For the next step, connect the calculation to your Business Finance & Profitability resource hub and build a cash flow forecast to prepare for the timing of incoming and outgoing cash.
References and Further Reading
OpenStax — Break-Even Sensitivity Analysis: how price and cost changes affect break-even.
U.S. Small Business Administration — Break-Even Point: formulas and planning considerations for small businesses.
OpenStax — Calculate a Break-Even Point in Units and Dollars: contribution margin and cost-volume-profit assumptions.
Discover more from
Subscribe to get the latest posts sent to your email.